Classroom Activities
Today we started by doing initial value problem:
We did this on our whiteboards, and ended up with
After that we went over the source free series RLC circuit, where we were assigned to find the second order linear equation for a source free RLC circuit;
We then did a practice example of using the formula above to find natural frequencies of a circuit
After lab, we went over the source free parallel RLC circuit. Turns out alpha changes from the R/2L value in the case of source free series RLC circuit to 1/2RC for source free parallel RLC circuit. We also did a practice example of the case involving source free parallel RLC circuit
"Series RLC circuit Step Response" Lab
For prelab, we were assigned to solve the second order differential equation for our circuit. From the values given, our circuit would be highly likely to undergo an underdamped case.
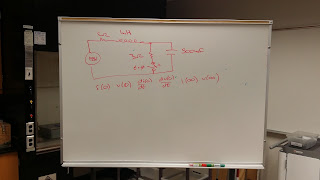
A picture of our circuit:
Value of the capacitor
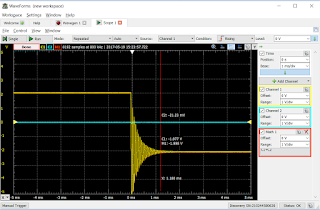
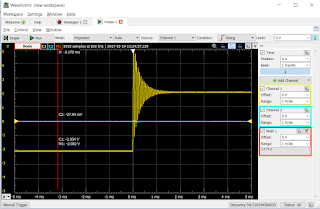
Waveform Result:
Still picture when it goes negative overshoot
Still picture when it goes positive overshoot
**VALUES**
We could see the effect of overshooting more clearly in this case where we set the voltage to be a step function that will be either -2 or 0, where we can see the effect of overshooting that makes the graph to reach a peak value of about 1.8, which is expected from our previous assumption and calculation.
Summary:
For resistors with small resistances, the value read on the DMM might be affected quite significantly due to the internal resistance of the DMM itself.
My previous assumption that I would never see anything above 5V (the max voltage that analog discovery could provide) was proven wrong by this experiment. The voltage went well over 5V, which I screwed up on adjusting the parameter to show, but it should go close to 6V during its positive overshoot if it were to be symmetric.
Using the formula of percent overshoot = 100 exp(-zeta*pi/sqrt(1-zeta^2)), I calculated the percent overshoot to be at 98%, which means that the overshoot should be making a graph that have a peak at about 5.92V, which seems likely but due to the unfortunate windowing performed in the wavelab we were not able to see. Other than the unfortunate fact that we were not able to see the overshoot, we did manage to get values that are pretty close to the ones calculated on the prelab.


No comments:
Post a Comment